Technical Overview > Architecture
Components of the CHT Ecosystem
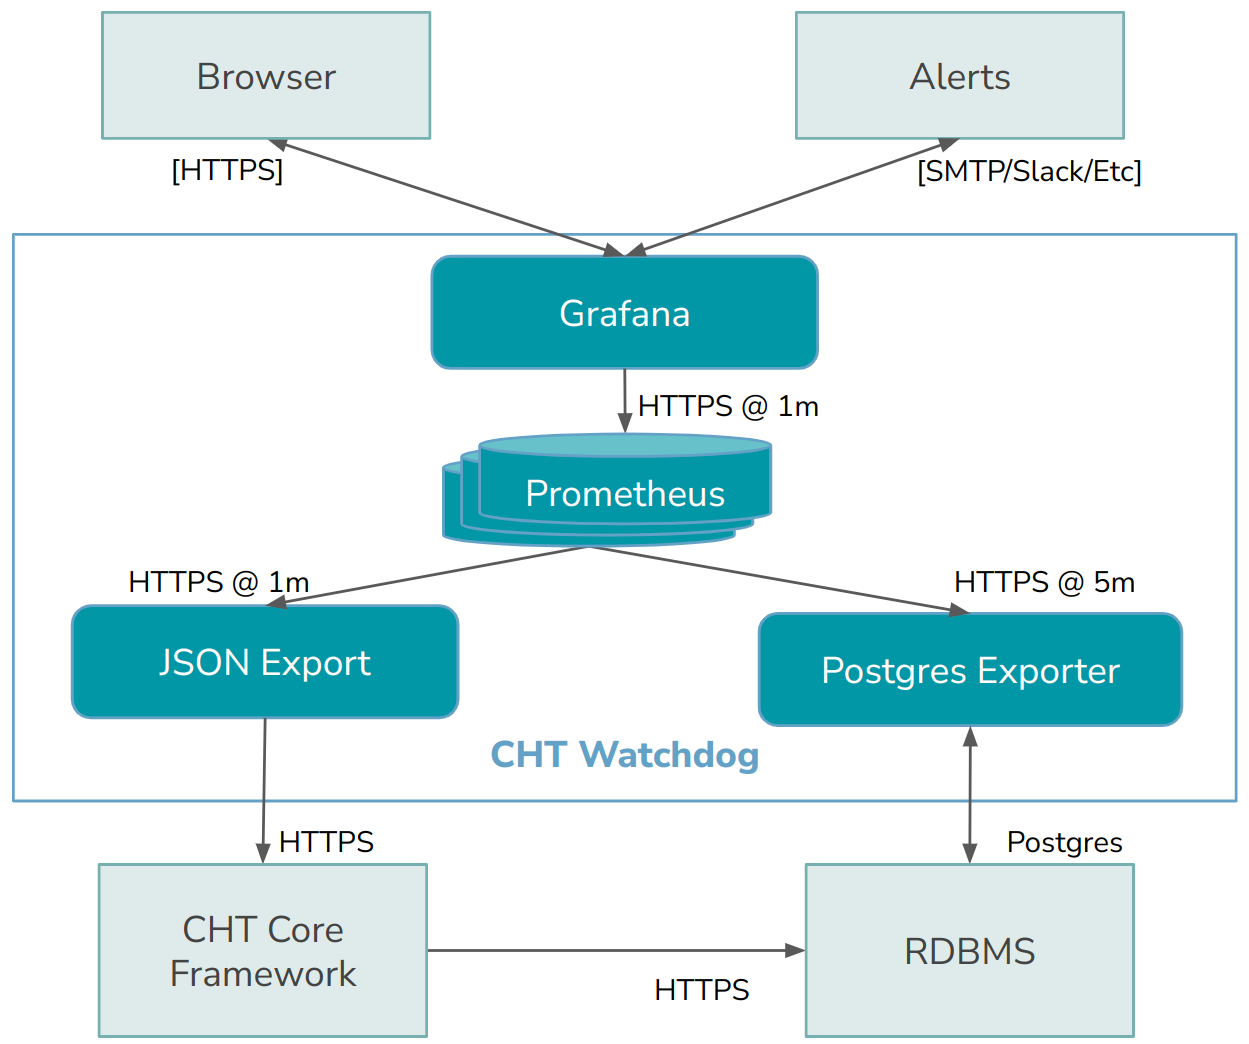
Monitoring and alerting system using Grafana and Prometheus
CHT Watchdog is deployed on a separate server so that you can watch for, and alert on, any critical issues with the CHT Core. Read more about setting up CHT Watchdog.

Data Flows
Grafana is a dashboard visualization and alerting software. It is open source and an industry standard for this task. There is an free repository of pre-existing dashboards which greatly reduce the time to create new dashboards and alerts. It can send alerts via email, Slack, SMS and many more.
Prometheus is an open source Time Series Database (TSDB) that was developed explicitly to do detailed longitudinal monitoring. It also aggregates metrics and can automatically cull older data to save on CPU and disk space.
JSON Exporter is a wrapper utility to convert a JSON API to be compatible with Prometheus scrape config. This is used to convert the CHT Monitoring API’s JSON.
Postgres Exporter allows Prometheus to scrape a Postgres database and at a predefined interval. The queries can be configured to ingest any relevant data needed.
For more information on these technologies, see CHT Core overview.
Components of the CHT Ecosystem
Using CHT Watchdog to Monitor and Alert on CHT Applications