Custom Postgres metrics in CHT Watchdog
Adding Custom Postgres metrics into CHT Watchdog
Introduction
After setting up your Watchdog instance and making it production ready, you can include additional custom metrics from your deployment. These metrics should be ingested by Prometheus and then can be used to create new Grafana dashboards and alerts. Example use cases include monitoring and alerting on health metrics like CHW visits per county or household registration rates, etc.
This guide will walk you through adding a custom metric from Postgres data. The following naming convention is used throughout to reference the relevant server instances: CHT Core (cht.example.com), CHT Watchdog (watchdog.example.com) and a Postgres server (db.example.com).
Base Flow
This is the initial basic flow of data from a CHT instance to Watchdog:
    flowchart LR

subgraph core["cht.example.com"]
  mon_api["Monitoring API (443)"]
end

subgraph watchdog["watchdog.example.com"]
    json[JSON Exporter] --> Prometheus
    Prometheus --> Grafana
end

mon_api  -->  json
Postgres Flow
This guide will have you deploy a Postgres Exporter on your Watchdog server (watchdog.example.com). This, in turn, will query your Postgres server (db.example.com):
    flowchart LR

subgraph core["cht.example.com"]
  mon_api["Monitoring API (443)"]
end

subgraph watchdog["watchdog.example.com"]
    json[JSON Exporter] --> Prometheus
    postgres-exp[Postgres Exporter] --> Prometheus
    Prometheus --> Grafana
end

subgraph db["db.example.com"]
  postgres["Postgres (5431)"]
end

mon_api  -->  json
postgres -->  postgres-exp
Adding a custom Postgres metric
The following steps are all performed on the CHT Watchdog instance and assume you installed Watchdog in ~/cht-watchdog. Note that user credentials with READ access to your Postgres server are required.
- Prepare query in config file
- Adding new scrape config
- Add new Postgres Exporter
- Configure the dashboard
- Optional: Add Dashboard to CHT Dropdown in Grafana
Prepare query in config file
Add a YAML file for with your query called ~/custom-sql-queries.yml. In this example we’ll be using a query from the App Monitoring Data Ingestion repo, but it can be any query as long as the user you’re using in the next step has access to the database and table:
dwh_impact_replication_failure:
  query: |
    SELECT
      metric as reason,
      count as total
    FROM
      public.app_monitoring_replication_failure_reasons
    WHERE
      partner_name IN ('partner_name_here')
  metrics:
    - reason:
        usage: "LABEL"
        description: "Name of the failure"
    - total:
        usage: "GAUGE"
        description: "Replication failure reasons"
This configuration will generate a metric named dwh_impact_replication_failure_total with a label named reason which contains the string key value identifying the aggregated reason for the given replication failures. These metric/label names are fully customizable, but to avoid confusion you should follow the Prometheus best practices when choosing names.
Adding new scrape config
Create the ~/scrape_config.custom-sql.yml file and point the config to our new Postgres Exporter (custom_sql_exporter:9187). This will tell Prometheus to scrape the new data every 1 minute:
scrape_configs:
  - job_name: 'custom-sql'
    scrape_interval: 1m
    static_configs:
      - targets: ['custom_sql_exporter:9187']
Add new Postgres Exporter
In a new file, ~/docker-compose.custom-sql.yml, define your new Postgres exporter as well as add a mount to the existing Grafana and Prometheus services. Note that you will need to add the following environment variables to your Watchdog ~/cht-watchdog/.env file:
CUSTOM_SQL_USER- Postgres user to use when logging inCUSTOM_SQL_PASS- Password forCUSTOM_SQL_USERaboveCUSTOM_SQL_SERVER- URL or IP for your Postgres serverCUSTOM_SQL_PORT- Port of server, defaults to5432it not declared.CUSTOM_SQL_DATABASE- Actual string of database name (egextra_monitoringorhealth_stats), will be different for each install.
services:

  prometheus:
    volumes:
      - ./scrape_config.custom-sql.yml:/etc/prometheus/scrape_configs/custom-sql.yml:ro

  custom_sql_exporter:
    image: prometheuscommunity/postgres-exporter:latest
    command:
      # disables the collection of all metrics except for custom queries
      - '--no-collector.database'
      - '--no-collector.postmaster'
      - '--no-collector.process_idle'
      - '--no-collector.replication'
      - '--no-collector.replication_slot'
      - '--no-collector.stat_bgwriter'
      - '--no-collector.stat_database'
      - '--no-collector.statio_user_tables'
      - '--no-collector.stat_statements'
      - '--no-collector.stat_user_tables'
      - '--disable-default-metrics'
      - '--disable-settings-metrics'
    volumes:
      - ../custom-sql-queries.yml:/custom-sql-queries.yml
    environment:
      DATA_SOURCE_NAME: "postgresql://${CUSTOM_SQL_USER:-NO DB USER SPECIFIED}:${CUSTOM_SQL_PASS:-NO DB PASSWORD SPECIFIED}@${CUSTOM_SQL_SERVER:-.NO DB SERVER SPECIFIED}:${CUSTOM_SQL_PORT:-5432}/${CUSTOM_SQL_DATABASE:-.NO DB SPECIFIED}?sslmode=disable"
      PG_EXPORTER_EXTEND_QUERY_PATH: "/custom-sql-queries.yml"
    restart: always
    networks:
     - cht-watchdog-net
Launch Watchdog with the new compose file
Now that you’ve added the new configuration files, we can load it alongside the existing ones. Assuming you’ve followed the Watchdog Setup, this would be:
cd ~/cht-watchdog
docker compose -f docker-compose.yml -f ../docker-compose.custom-sql.yml up -d
Configure the dashboard
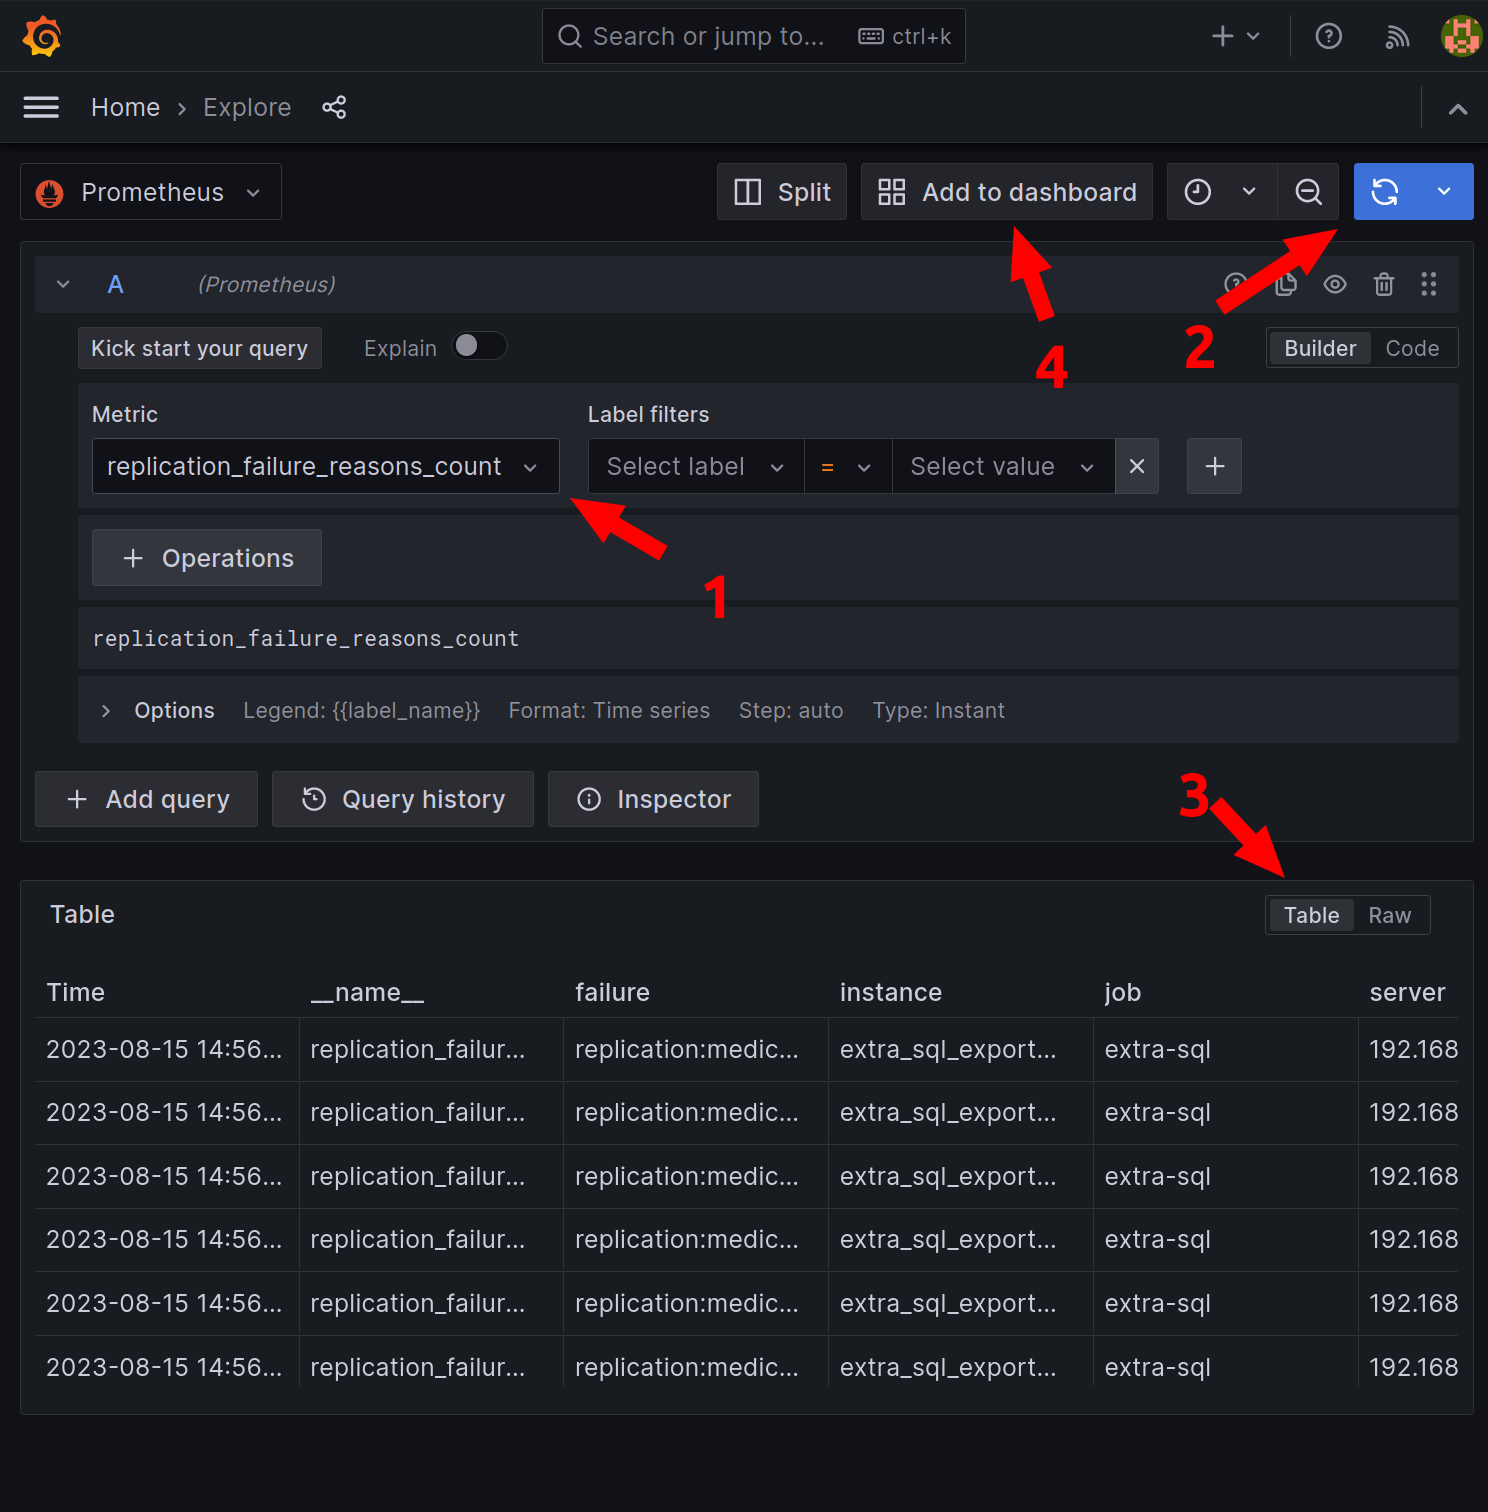
Now that the new Postgres Exporter is running on your Watchdog instance and CHT Watchdog’s Prometheus has additional scrape configs to ingest the new metrics, we can now visualize it in a Grafana Dashboard and then alert on it:
- In the “Metric” field enter
dwh_impact_replication_failure_totalfrom the step above where we definedcustom-sql-queries.yml - Click the blue “Run query” in the upper right.
- We’ll make this a table, but you can configure the dashboard as desired.
- Click “Add to dashboard”

Grafana showing data data explorer
Optional: Add Dashboard to CHT Dropdown in Grafana
An additional optional step is to make your dashboard a peer of the existing “Admin Details” and “Admin Overview”. Do this by editing the JSON by finding the line with "graphTooltip": 0, and add this JSON after it:
  "links": [
    {
      "asDropdown": true,
      "icon": "external link",
      "includeVars": true,
      "keepTime": true,
      "tags": [],
      "targetBlank": false,
      "title": "CHT Admin Extra SQL",
      "tooltip": "",
      "type": "dashboards",
      "url": ""
    }
  ],
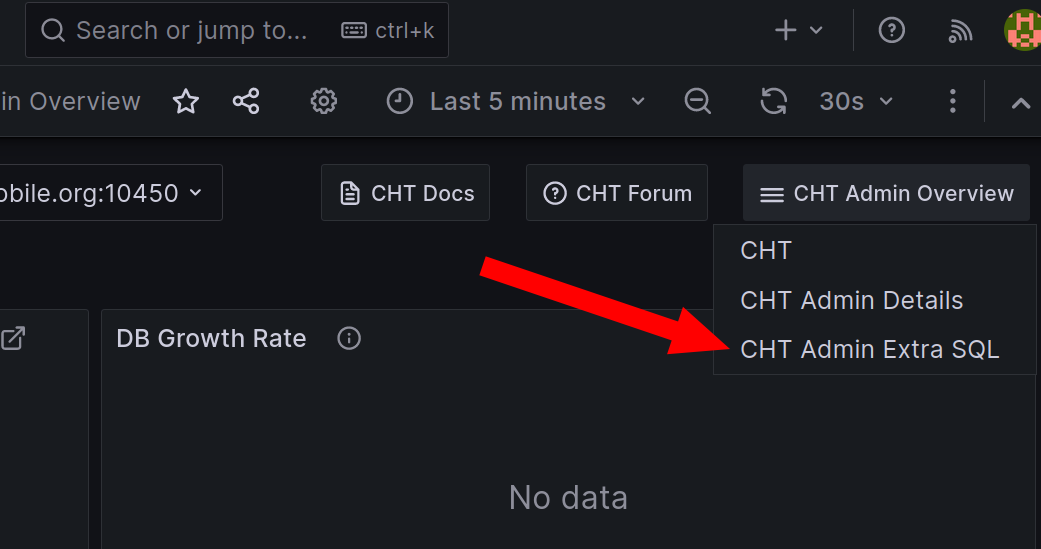
This will make your new dashboard show up natively with the two existing CHT dashboards:

Grafana with a third Admin Extra SQL option showing in the existing CHT navigation menu
Full Dashboard JSON
For reference, here is the full JSON of the dashboard we created above as shown in the “Save” modal:
{
  "annotations": {
    "list": [
      {
        "builtIn": 1,
        "datasource": {
          "type": "grafana",
          "uid": "-- Grafana --"
        },
        "enable": true,
        "hide": true,
        "iconColor": "rgba(0, 211, 255, 1)",
        "name": "Annotations & Alerts",
        "type": "dashboard"
      }
    ]
  },
  "editable": true,
  "fiscalYearStartMonth": 0,
  "graphTooltip": 0,
  "links": [
    {
      "asDropdown": true,
      "icon": "external link",
      "includeVars": true,
      "keepTime": true,
      "tags": [],
      "targetBlank": false,
      "title": "CHT Admin Extra SQL",
      "tooltip": "",
      "type": "dashboards",
      "url": ""
    }
  ],
  "liveNow": false,
  "panels": [
    {
      "datasource": {
        "type": "prometheus",
        "uid": "PBFA97CFB590B2093"
      },
      "fieldConfig": {
        "defaults": {
          "custom": {
            "align": "auto",
            "cellOptions": {
              "type": "auto"
            },
            "inspect": false
          },
          "mappings": [],
          "thresholds": {
            "mode": "absolute",
            "steps": [
              {
                "color": "green",
                "value": null
              },
              {
                "color": "red",
                "value": 80
              }
            ]
          },
          "unit": "short"
        },
        "overrides": [
          {
            "matcher": {
              "id": "byName",
              "options": "__name__"
            },
            "properties": [
              {
                "id": "custom.hidden",
                "value": true
              }
            ]
          },
          {
            "matcher": {
              "id": "byName",
              "options": "instance"
            },
            "properties": [
              {
                "id": "custom.hidden",
                "value": true
              }
            ]
          },
          {
            "matcher": {
              "id": "byName",
              "options": "job"
            },
            "properties": [
              {
                "id": "custom.hidden",
                "value": true
              }
            ]
          },
          {
            "matcher": {
              "id": "byName",
              "options": "server"
            },
            "properties": [
              {
                "id": "custom.hidden",
                "value": true
              }
            ]
          },
          {
            "matcher": {
              "id": "byName",
              "options": "Time"
            },
            "properties": [
              {
                "id": "custom.hidden",
                "value": true
              }
            ]
          },
          {
            "matcher": {
              "id": "byName",
              "options": "failure"
            },
            "properties": [
              {
                "id": "custom.width",
                "value": 462
              }
            ]
          }
        ]
      },
      "gridPos": {
        "h": 10,
        "w": 18,
        "x": 0,
        "y": 0
      },
      "id": 1,
      "options": {
        "cellHeight": "sm",
        "footer": {
          "countRows": false,
          "fields": "",
          "reducer": [
            "sum"
          ],
          "show": false
        },
        "showHeader": false,
        "sortBy": [
          {
            "desc": true,
            "displayName": "Value"
          }
        ]
      },
      "pluginVersion": "10.0.1",
      "targets": [
        {
          "datasource": {
            "type": "prometheus",
            "uid": "PBFA97CFB590B2093"
          },
          "editorMode": "builder",
          "exemplar": false,
          "expr": "dwh_impact_replication_failure_total",
          "format": "table",
          "instant": true,
          "key": "Q-e238fdbd-aed6-4215-a3e8-c611c6586c64-0",
          "legendFormat": "",
          "range": false,
          "refId": "A"
        }
      ],
      "title": "Replication failure reason",
      "type": "table"
    }
  ],
  "refresh": "5s",
  "schemaVersion": 38,
  "style": "dark",
  "tags": [],
  "templating": {
    "list": []
  },
  "time": {
    "from": "now-5m",
    "to": "now"
  },
  "timepicker": {},
  "timezone": "",
  "title": "CHT Admin Extra SQL",
  "uid": "a71db640-cc40-452c-aa92-222a9b49d43b",
  "version": 8,
  "weekStart": ""
}Did this documentation help you ?