Integrating CHT Watchdog
Scraping and alerting external sources with CHT Watchdog
Going beyond basic setup
After you have done the setup of CHT Watchdog and configured it to run with TLS and have backups enabled, you may want to extend it to scrape other Prometheus data sources so that Grafana can send alerts on non-CHT Core metrics.
This guide uses example instances of CHT Core (cht.example.com) and CHT Watchdog (watchdog.example.com). When deploying, be sure to replace with your own hostnames.
Default Flow
Let’s look at how the default deployment of Watchdog works when configured to only gather metrics from CHT Core’s monitoring API:
    flowchart LR

subgraph core["cht.example.com"]
  mon_api["Monitoring API (443)"]:::client_node
end

subgraph watchdog["watchdog.example.com"]
    json[JSON Exporter] --> Prometheus
    Prometheus --> Grafana
end

mon_api --> json
Additional Flows
Your Prometheus instance from CHT Watchdog can ingest data from any supported data source accessible via an HTTPS request. These data sources might be hosted on the same server as CHT Core or on a completely different server.
The focus of this guide is to collect metrics on Docker container usage and performance from the server hosting our CHT Core instance using cAdvisor.
    flowchart LR

subgraph core["cht.example.com"]
  mon_api["Monitoring API (443)"]:::client_node
  cAdvisor:::client_node
end

subgraph watchdog["watchdog.example.com"]
    json[JSON Exporter] --> Prometheus
    Prometheus --> Grafana
end

mon_api  -->  json
cAdvisor["cAdvisor (8443)"] -->  Prometheus
Note that because CHT Core is listening on port 443 already, we’ll have cAdvisor listen on port 8443.
By reading this guide you should not only be able to set up cAdvisor, but also be familiar with extending CHT Watchdog to support any other vital metrics.
Steps to new integrations
While this is a specific example for cAdvisor, these same steps will be taken to extend Watchdog for other metrics:
- CHT Core: [Create both cAdvisor and Caddy Docker Compose files]cadvisor-compose-file)
- CHT Core: Start the Caddy and a cAdvisor containers along with the CHT Core
- CHT Watchdog: Adding new scrape and compose configs
- CHT Watchdog: Restart the Prometheus and Grafana server to include the new scrape config mounts
- CHT Watchdog: Importing an existing cAdvisor dashboard from
grafana.com
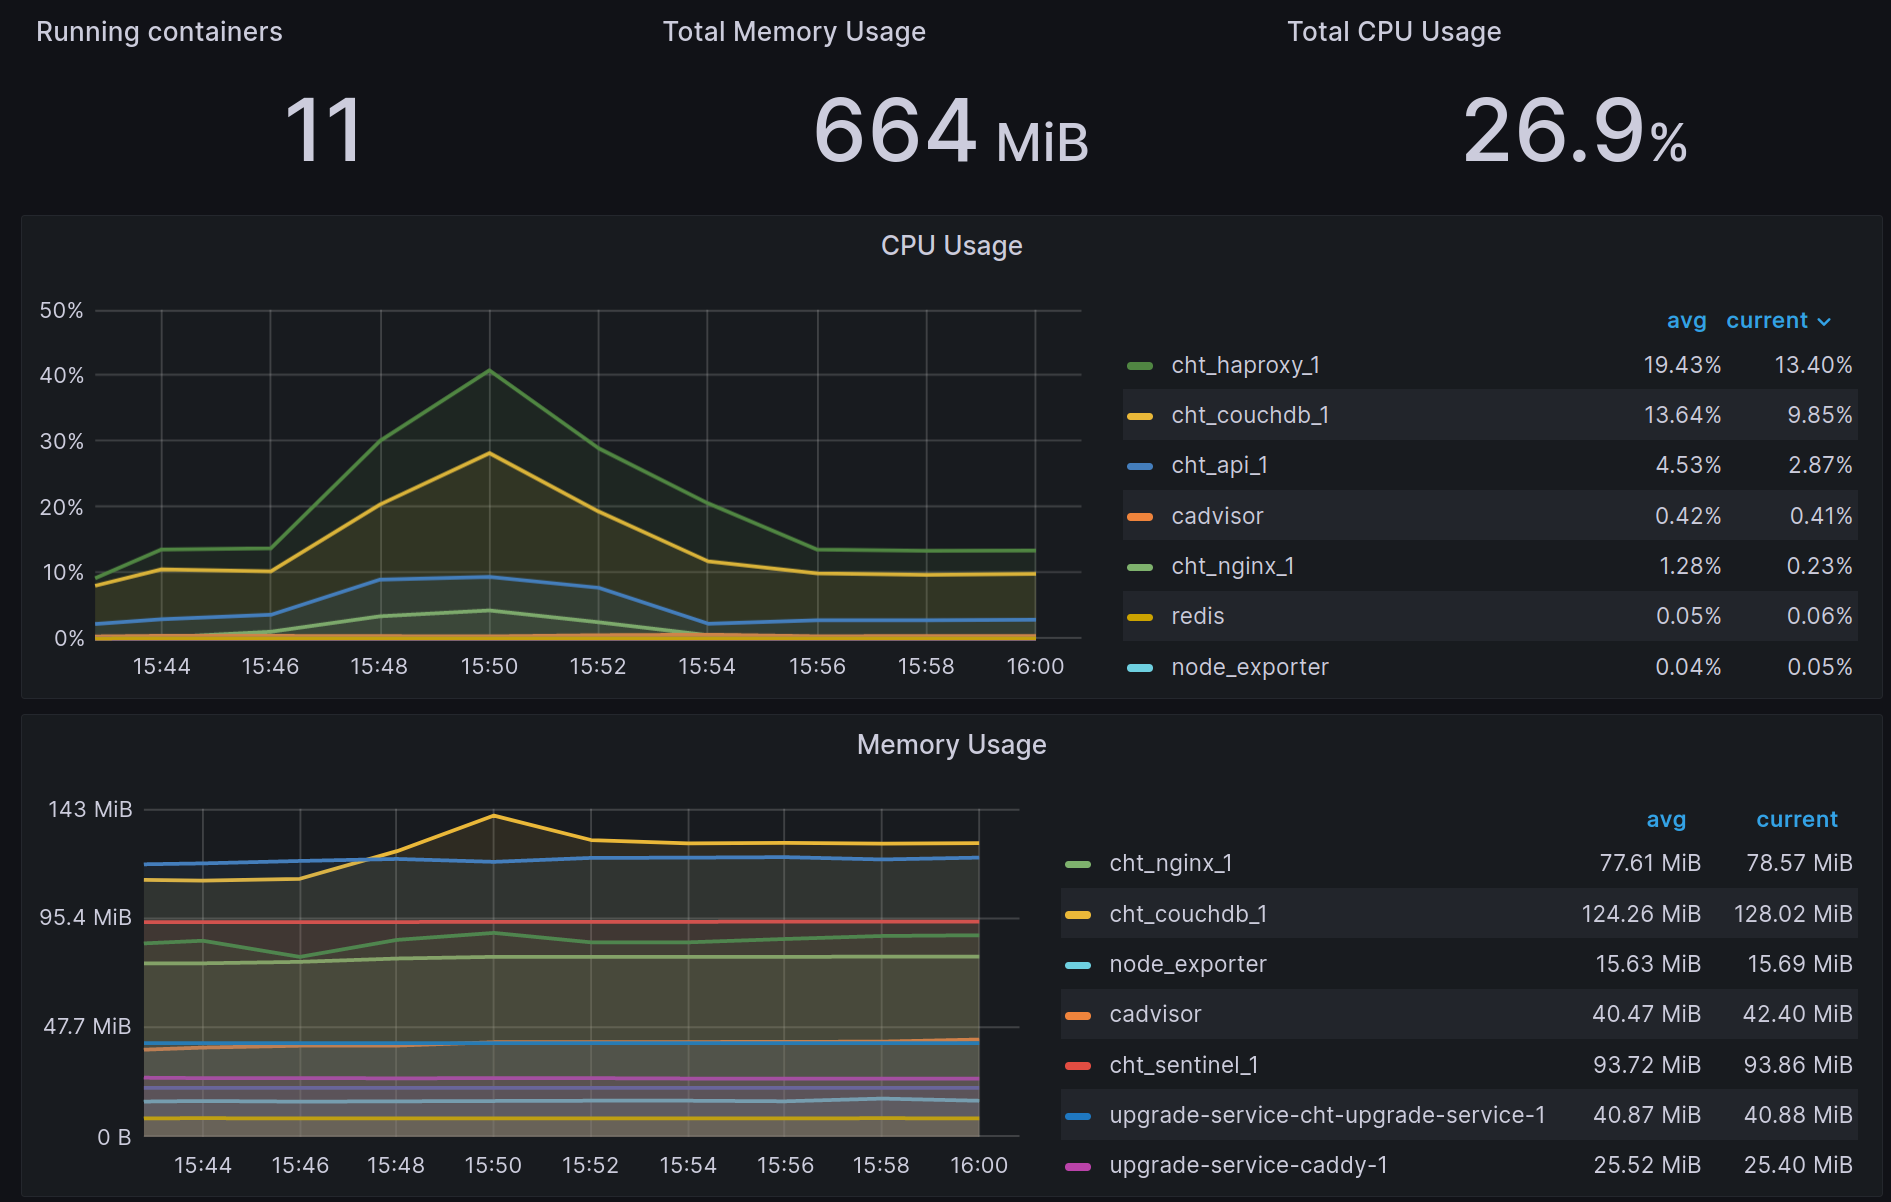
After completing these steps, we now have Docker metrics we can alert on:

Screenshot of Grafana Dashboard showing data from Prometheus
Read on below on how to set this up!
Integrating with cAdvisor
On CHT Core
cAdvisor Compose file
On your CHT instance, add a Docker composer file for the new cAdvisor service. Note this also includes a Redis caching layer. Also note that we’re reducing cAdvisors CPU usage by adding 3 extra flags in the command stanza. In our example, we’ve put this file in /home/ubuntu/cht/compose/cadvisor_compose.yml with these contents:
services:
  cadvisor:
    image: gcr.io/cadvisor/cadvisor:latest
    container_name: cadvisor
    volumes:
      - /:/rootfs:ro
      - /var/run:/var/run:rw
      - /sys:/sys:ro
      - /var/lib/docker/:/var/lib/docker:ro
    depends_on:
      - redis
    networks:
      - cht-net
    command:
      - "--housekeeping_interval=30s"
      - "--docker_only=true"
      - "--disable_metrics=percpu,sched,tcp,udp,disk,diskIO,accelerator,hugetlb,referenced_memory,cpu_topology,resctrl"
  redis:
    image: redis:latest
    container_name: redis
    networks:
      - cht-net
Caddy Config and Compose files
Like we did in the TLS section, we’ll add both a /home/ubuntu/Caddyfile and a /home/ubuntu/cht/compose/caddy-compose.yml.
Starting with the Caddyfile, let’s assume your server’s DNS entry is cht.example.com. We can expose cAdvisor’s service running on localhost port 8443 with this compose file. This tells Caddy to reverse proxy requests to the public interface to the private Docker network interface on port 8080 where cAdvisor is running:
cht.example.com:8443 {
    reverse_proxy cadvisor:8080
}
Then we can add the compose file to run Caddy. Note that it’s mounting the config file we just created:
services:
  caddy:
    image: caddy:2-alpine
    restart: unless-stopped
    ports:
      - "8443:8443"
    volumes:
      - /home/ubuntu/Caddyfile:/etc/caddy/Caddyfile
    networks:
      - cht-net
Start cAdvisor, Caddy and CHT Core with Docker
Now that we have all the config files in place, you need to have Docker start everything together. This is so that the containers can see each other on the same CHT Net Docker network. You will need to specify each of the compose files every time you start, stop or restart CHT instance so all the services stay running and connected.
Assuming you followed the production steps to install the CHT, you use this Compose call to first stop all containers and then start them all up, including the new services:
cd /home/ubuntu/cht/upgrade-service
docker stop $(docker ps --quiet)
docker compose up --detach
Note that the CHT Upgrade Service will process all Docker Compose file in the /home/ubuntu/cht/compose directory for us and we don’t need to explicitly specify them in the docker compose up command.
On CHT Watchdog
Scrape config
We’ll first create the ~/cadvisor-prometheus-conf.yml file and point the config to our CHT Core URL:
scrape_configs:
  - job_name: 'cadvisor'
    scrape_interval: 5s
    scheme: 'https'
    static_configs:
      - targets: ['cht.example.com:8443']
CHT Watchdog allows you to use additional Docker Compose files to add as many additional Prometheus scrape configs as are needed. Here, we’ll create one in ~/cadvisor-compose.yml pointing to our cadvisor-prometheus-conf.yml file from above.
services:
  prometheus:
    volumes:
      - /root/cadvisor-prometheus-conf.yml:/etc/prometheus/scrape_configs/cadvisor.yml:ro
Load new Compose files with existing ones
Now that you’ve added the new configuration files, we can load it alongside the existing ones. Assuming you’ve followed the Watchdog Setup, this would be:
cd ~/cht-monitoring
docker compose -f docker-compose.yml -f ../cadvisor-compose.yml up -d
Import Grafana Dashboard
Now that cAdvisor is running on your CHT Core instance and CHT Watchdog’s Prometheus has additional scrape configs to ingest the cAdvisor metrics, we can now visualize it in a Grafana Dashboard and then alert on it.
- Log into your Watchdog instance
- Click the upper left hamburger menu and click “Dashboards”
- Find the “New” button on the left, click and choose “Import” from the drop down
- On the next page, scroll down to find “Import via grafana.com”, enter ID
193(for the Docker monitoring dashboard) and click “Load” - Confirm the “Name” and “Folder” values and select “Prometheus” as the data source in the dropdown. Finally, click the “Import” button at the bottom of the page.
That’s it! After following these steps, you should be looking at the cAdvisor dashboard as shown above. From here, you can both customize this dashboard as well as add alerts as needed.
Did this documentation help you ?