Build > Targets > targets.js
Definition of target widgets calculated and seen in the app
Dashboards to track metrics for an individual CHW or for an entire health facility
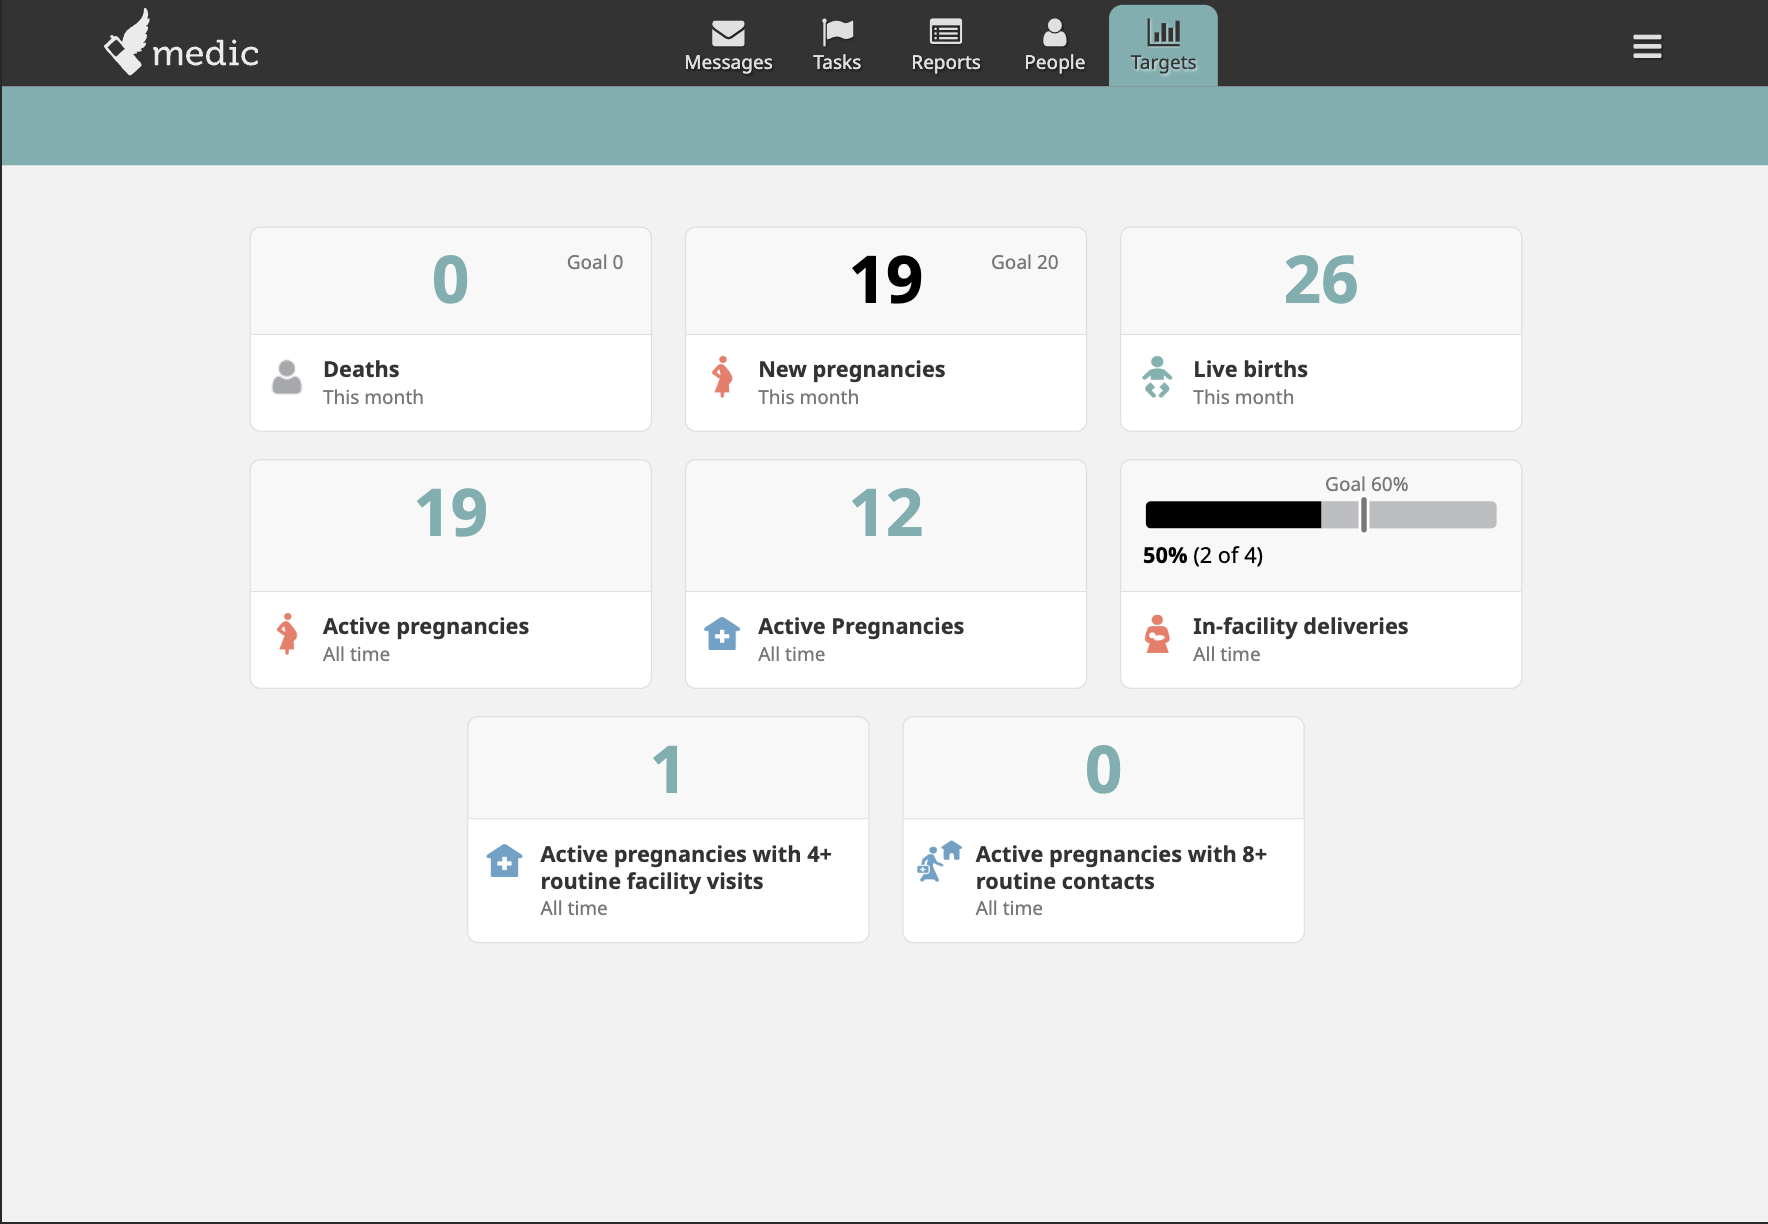
Targets is the user dashboard or analytics tab. The widgets on this tab provide a summary or analysis of the data in submitted reports. These widgets can be configured to track metrics for an individual CHW, for a Supervisor overseeing a group of CHWs, or for an entire health facility.
For CHWs, the Targets tab provides a quick summary of their progress towards their individual goals. For Supervisors, Nurses, and facility-based users, the Targets tab provides important insights into how their community unit is performing.

Important
Targets or goals can be configured for any user that has offline capabilities. A user must have access to the report in order to generate the widget with its data.
There are two basic types of widgets: count and percent. Count widgets display a numeric sum while percent widgets display progress towards achieving a target.
The text, icon, goal, and time frame of each widget is easily configured. The time frame is set per widget, and set to show values for “this month” (resets back to zero at the beginning of each month) or “all time” (a cumulative total).
Count widgets show a tally of a particular report that has been submitted or data within a report that matches a set of criteria. For example, a count can be done for the number of new pregnancies, the number of facility-based deliveries, or the number of households registered that month.
A count without a goal displays a simple green number count. A count with a goal displays the value of the goal on the right side and a colored count in the center indicating progress towards achieving the goal. Progress is displayed in green if the count is equal to or above the goal, or in black if the count is below the goal.
Percent widgets display a ratio, which helps to provide insight into the proportion that matches a defined criteria. For example, the proportion of newborns delivered in a facility can be presented as a percent with respect to all registered deliveries.
An optional goal can be set, such as “100% of patients with a fever should be given a malaria Rapid Diagnostic Test (mRDT),” to visualize progress towards achieving a target. Widget styling is configured to show green if the goal has been met and black if the goal has not been met. Next to the percent with a goal, the count of reports used in the calculation are shown (e.g. “16 of 20 with mRDT”). CHWs have found this helpful in interpreting target information.
Definition of target widgets calculated and seen in the app
Schema for CHT database objects
Send aggregate, patient, and event data to DHIS2
Supervision and workforce management to strengthen health systems