Dashboards and Reporting
Data visualization and reporting tools for supervision
Supervisor Dashboards

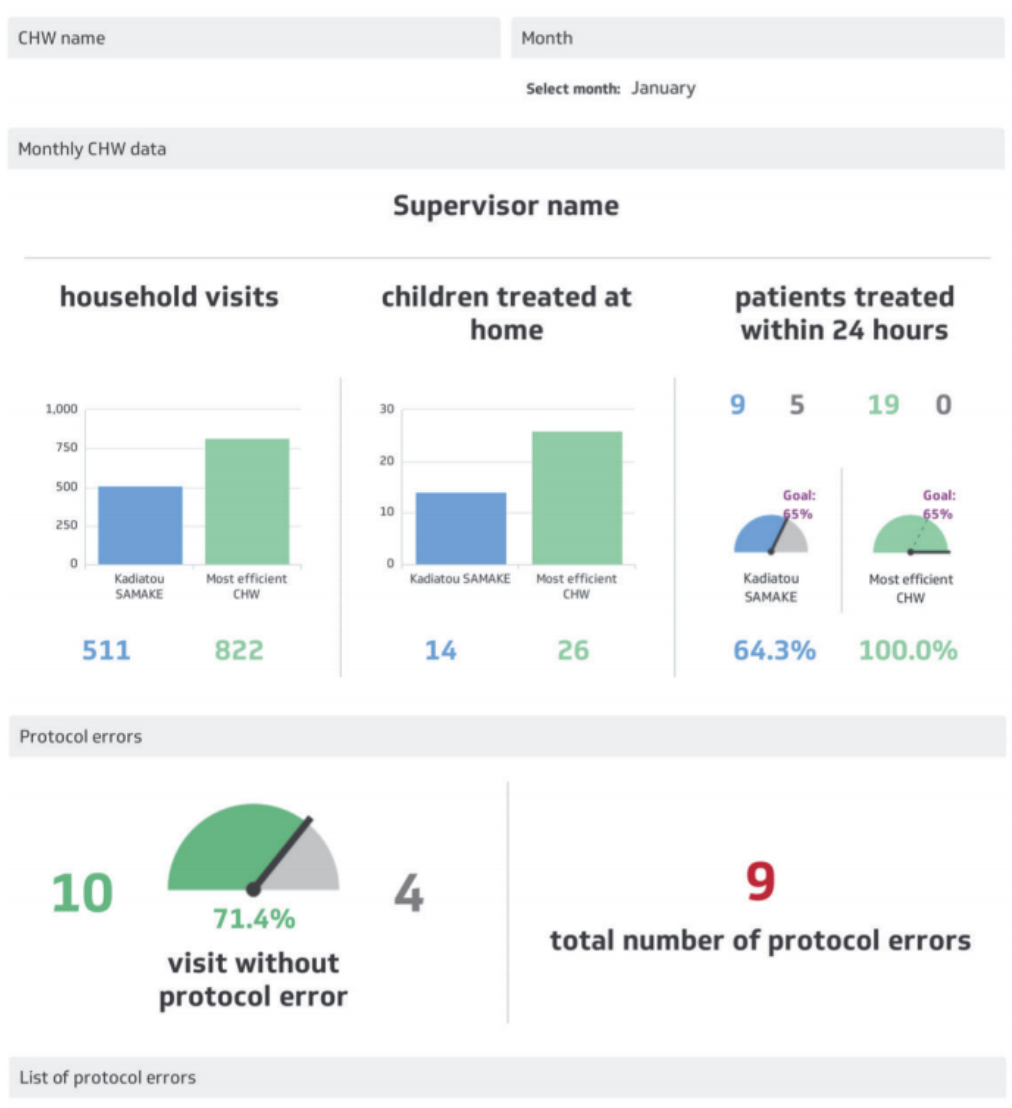
Program dashboards track, visualize, and share health progress with stakeholders more broadly. Supervisors can use program dashboards to help articulate their CHW cohorts activities and how they align with program impact standards and indicators. Summary statistics of CHW service area performance (e.g. number of home visits, number of protocol errors, etc) help to identify areas for continued improvement and deeper audits of care data.
The data that can be visualized is highly configurable, and depends on what data fields are configured in a particular CHT app’s forms. Dashboards can be built using any software that supports visualizing data with the widely used PostgreSQL database. Examples include the open source tool Superset, as well as proprietary technologies like Klipfolio and Tableau.
DHIS2 Data Verification
Supervisors often provide a critical bridge between CHWs and broader health system reporting. Using the CHT’s DHIS2 integration, Supervisors can see the aggregate of each DHIS2 Data Value across all CHWs in their area. By tapping on a target, they can also see each CHW’s contribution towards that total. Once the Supervisor has verified data accuracy with CHWs, they can communicate with Health Records Information Officers to feed data into the national health information system.
Did this documentation help you ?